The second semester can be a time of excitement and renewal, a fresh start, especially in the new year! However, it can also be a time when teachers, administrators, students, and parents feel pressure as the end of the school year and graduation (for some) is only a few months away. Many schools use the start of the second half to reevaluate strategies, schedules, strategic plans, and even staffing. Even at the elementary school level, students’ schedules are sometimes adjusted to permit additional support, tutoring, or other interventions. Teachers and parents may request a parent-teacher conference, particularly regarding IEP goals, progress, or lack thereof. At the middle school level, some principals modify schedules to create or adjust remedial sections to support students who are falling behind. At the high school level, many schools track students’ progress toward graduation and offer accelerated options for students who are off track or at risk of failing required courses. In addition, high schools often take additional measures to assist students who are not attending regularly or whose attendance has declined.
Not long into the second semester, schools often become increasingly focused or strategic about ensuring that students are mastering the “tested” or “core” standards assessed on their end-of-year summative assessments (i.e., state tests). Standardized testing, of course, has long been a controversial topic among educators and parents. On the one hand, some argue that annual assessments hold schools accountable and provide the community with feedback on their schools’ academic status. Others argue that tests take up too much instructional time, are detrimental because they narrow the curriculum, and cause emotional stress on students. Still others question the reliability, validity, and importance of standardized test results. Nevertheless, federal law – the Every Student Succeeds Act (ESSA) – requires states to conduct annual standardized testing in reading/language arts and math for grades 3-8 and once in high school. It also mandates science testing once in each of the following grade spans: 3-5, 6-9, and 10-12 (NEA, 2020, and ESSA, 2015a).
However, ESSA has been modified to permit states more flexibility. For example, states may use alternative high school assessments as components of the accountability system, such as the SAT or ACT. Several states are also piloting “through-year assessment systems.” This approach allows schools to administer multiple tests throughout the school year as part of an assessment system that produces a single summative score that meets federal and state accountability requirements (ESSA, 2015b).
States utilizing through-year assessments hope to address “long-standing, legitimate concerns expressed by students, families, and educators about traditional end-of-year summative assessments’ inability to: Provide timely and accurate information to inform school improvement needs; Support teaching and learning or connect to curriculum; and Reduce concerns about the overall footprint of summative tests. Thirteen states currently administer multiple assessments during the school year as part of their summative assessment system, including Alaska, Delaware, Florida, Georgia, Indiana, Kansas, Louisiana, Maine, Montana, Nebraska, North Carolina, Texas, and Virginia” (Education First, 2023).
As Woo and Diliberti (2022) note, “there are many types of assessments with different purposes and stakeholders. For instance, assessments include low-stakes, small-scale formative assessments embedded in classroom instruction and typically administered rapidly. Such assessments help teachers identify and understand students’ learning gaps, thereby allowing them to improve their instruction and student learning. On the other end of the spectrum, schools also administer summative assessments, which evaluate student learning against a set of learning objectives or standards at the end of a unit, course, semester, or school year, for purposes such as evaluation or accountability. High-stakes end-of-year statewide assessments that are tied to federal accountability requirements fall within this latter category.”
Benchmark assessments are situated between formative and summative assessments. While benchmark assessments have a summative function, in that they provide information about the effectiveness of instructional programs, their primary purpose in many districts is to help guide preparation for the end-of-year mandated assessments. In other words, they are meant to be predictive. However, like formative assessments, benchmark assessments also have an instructional role, as they can be used to identify students’ strengths and areas for growth and to inform teachers’ instructional decisions.
To be effective predictors, however, benchmark assessments must actually align with the state standards. In a study by Woo & Diliberti (2022), more than 80 percent of principals reported that their schools’ benchmark assessments were aligned with their state standards and state summative assessments. However, only two-thirds of English language arts (ELA) and math teachers felt that their benchmark assessments aligned with their curriculum materials. According to the RAND researchers, nearly all K–12 public schools (99%) reported administering at least one benchmark assessment to at least some of their students in the 2021–2022 school year.
The extent to which schools focus on test preparation varies widely, and again, testing in general is not popular with many teachers and parents. Still, there is little doubt that most educators are well aware that they will be held mainly accountable by their students’ results on high-stakes standardized tests. This becomes increasingly apparent and pressing as the second semester progresses.
—————————————-
“In the 2022-23 school year, the U.S. high school graduation rate for Asian/Pacific Islander students was the highest at approximately 98.7%, followed by White students at 88.4% and Hispanic students at 86.9%. Black and American Indian/Alaska Native students had the lowest graduation rates at 81.3% and 75.3%, respectively” (NCES, 2024).
At the high school level, computer software programs provide valuable on-time data to assist guidance counselors in managing and supporting students as they progress toward graduation. In addition, many schools hire staff whose primary responsibility is to track students’ progress and provide support so that students stay in school, attend regularly, and complete the required courses. These strategies are particularly important in schools with low attendance and graduation rates.
For students who have challenging scheduling considerations (such as part-time jobs, childcare, or other family responsibilities), have failed required courses, or are struggling with coursework, many high schools now also offer alternative curriculum options. These include 100% virtual courses where students work at their own pace (either on site or at home) and can relearn material if they are not successful the first time. This type of online credit recovery (CR) program is most common at 71%, followed by a blended structure with online tools and an in-person facilitator at 46% and in-person instruction at 42% (USDOE, 2018). Some online CR programs allow students to pretest out of modules, reducing the number of modules they need to complete. In most districts, however, online programs are accompanied by live virtual teacher support during designated hours.
A large percentage of high schools reported offering some form of CR options. The percentage reported ranges from 75% (Heinrich, 2022) to nearly 90% (USDOE, 2018). Similarly, the percentage of students reported to have used CR programs varied somewhat across research studies, from 6% to 15%. According to the USDOE (2018), some schools have participation rates as high as 29% of students using the programs. While some students may take a full year (or semester) to complete a course, many students complete courses more quickly. According to Heinrich (2022), online CR learning is more cost-efficient (about 50% the cost of in-person credit recovery programs). However, in-person learning shows greater opportunities for teacher-student interactions to support instruction and monitor students’ progress.
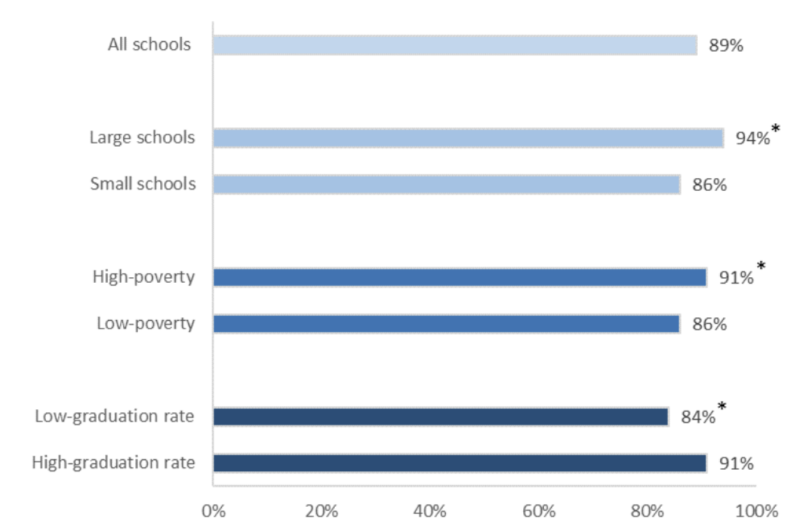
Percentage of high schools that offered credit recovery courses by selected school characteristics (Source: USDOE Brief, 2018; * Indicates statistical significance at p ≤ .05)
In one study, students who fail courses and enroll in online CR were “20 percentage points more likely to earn course credit… and are about eight percentage points more likely to graduate high school within four years than students who repeat courses traditionally” (Viano & Henry, 2024).
Formative and benchmark assessments can provide valuable information that helps teachers adjust classroom instruction. Critical curriculum content might be repeated or taught using different modalities or in small groups. Similarly, credit recovery courses provide students with opportunities to repeat content, either the entire course or selected units. However, these are just two of many strategies schools use to improve student learning. Schools create in-school, before-school, and after-school remedial and tutorial programs. Teachers can reorganize small groups, change rotation stations, and utilize paraprofessionals and outside specialists (pull-out or push-in). Of course, these efforts occur throughout the year, not just during the second semester. However, as the school year progresses, students’ needs often can become more evident and urgent.
At the National Center for Elimination of Educational Disparities (NCEED), a national interdisciplinary research center (https://nceed.morgan.edu/), we are driven to conduct research and provide interventions that address critically important questions about the academic, social, and emotional outcomes of all children. The effectiveness, efficacy, and equity of programs such as formative testing and credit recovery are among the many areas that NCEED researchers may address. The December edition of the Equity Express reviews many of the topics addressed over the past year. In this edition, the Director’s Desk article discusses some of NCEED’s current partnerships.
References:
Education First, 2023. Policymakers’ guide to through-year assessments: Addressing ESSA pain points.
ESSA, 2015a. Statute at Large 129 Stat. 1802 – Public Law No. 114-95.
https://www.congress.gov/bill/114th-congress/senate-bill/1177/text
ESSA, 2015b. Every Student Succeeds Act §1111, S.1177. (December 10, 2015). 114th Congress. Retrieved November 27, 2025, from https://www.congress.gov/bill/114th-congress/senate-bill/1177/text
Heinrich, C. (2022). Design Principles for Effective Online Credit Recovery. Ed Research for Recovery Design Principles Series. Ed Research for Recovery Project. Vanderbilt University.
NEA, 2020. Education Policy & Practice Staff, https://www.nea.org/resource-library/just-facts-what-you-need-know-about-essa#.
NCES, 2024. National Center for Educational Statistics. https://nces.ed.gov/programs/coe/indicator/coi/high-school-graduation-rates
Perie, M., Marion, S., & Gong, B. (2009). Moving toward a comprehensive assessment system: A framework for considering interim assessments. Educational measurement: Issues and practice, 28(3), 5–13.
Schuette, C. T., Wighting, M. J., Spaulding, L. S., Ponton, M. K., & Betts, A. L. (2010). Factors that Influence Teachers’ Views on Standardized Tests.
USDOE, 2018. U.S. Department of Education Office of Planning, Evaluation and Policy Development Policy and Program Studies Service Issue Brief: Credit Recovery. https://www.ed.gov/sites/ed/files/rschstat/eval/high-school/credit-recovery.pdf
Viano, S., & Henry, G. T. (2024). Online credit recovery as an intervention for high school students who fail courses. Educational Policy, 38(1), 218–253.
Woo, A. & Diliberti, M. (2022). The role of benchmark assessments in coherent instructional systems.
Woo, A., & Diliberti, M. K. (2023). The Role of Benchmark Assessments in Coherent Instructional Systems: Findings from the 2022 American Instructional Resources Survey. American Educator Panels. Research Report. RR-A134-19. RAND Corporation.